

- cross-posted to:
- [email protected]
- cross-posted to:
- [email protected]
Only semi-beautiful, but I tried
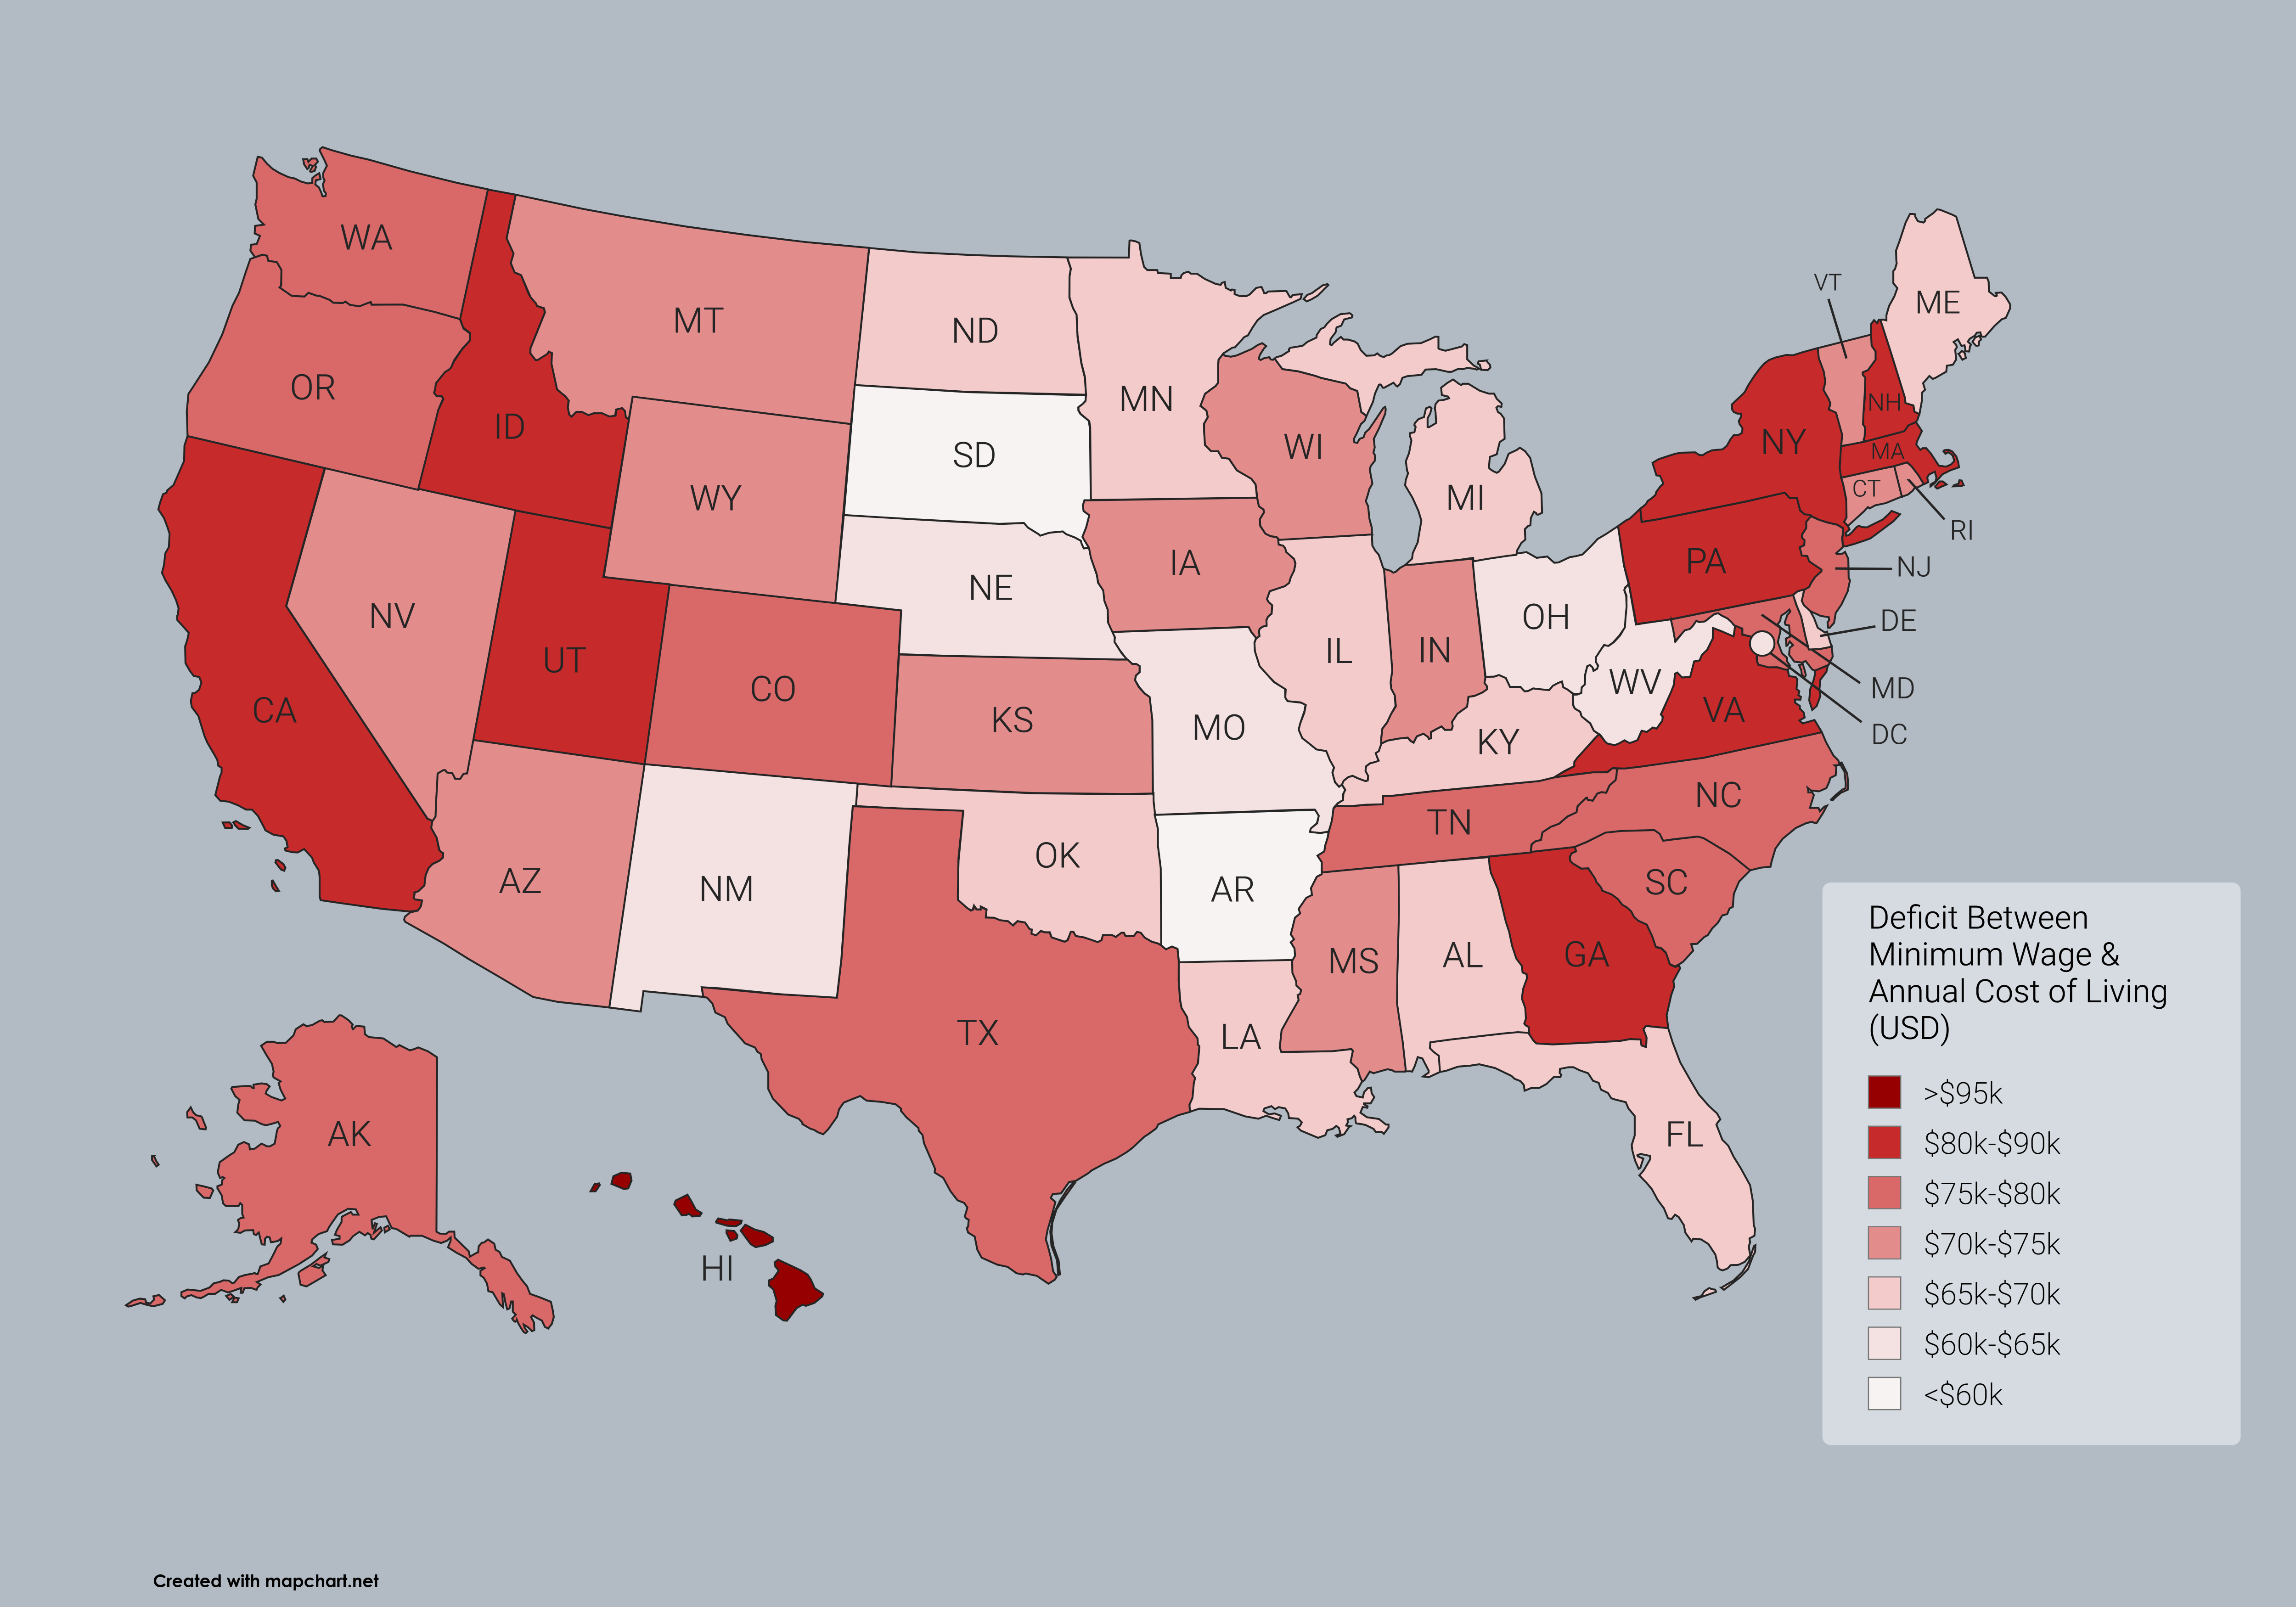
Annual cost of living data according to SmartAsset 2025 Report, except for DC which is not included in their reporting.
DC annual cost of living was estimated to be $99,424 per separate data, however it may be outdated. This would place DC as less expensive than 18 states by 2025 numbers, which is probably lower than it should be.
Minimum wage income assumes 40 hours per week by 52 weeks a year at the minimum wage rate.
You must log in or # to comment.
This is interesting because it not just a population map.
Thank you! I wanted to make it for my own visualization after seeing the SmartAsset report.
Often people focus on raw cost of living, which would look like a very different map outside of the extreme ends of the scales. Considering the deficit between the lowest paid work and the cost of living I think gives a bit more insight. I think the minimum floor always exists as a threat to higher paid labor in the sense that if skilled professionals, like nurses, ask/strike for better pay then the response usually starts from “if you dont like nursing for $X/hour, then go flip burgers for $Y/hour”
Even if few people actually earn at the minimum wage, the fact that many states still cap at the federal $7.25 means the bar is quite low in those states for all work paid above minimum as well.
Of course the primary visual that is easy to glean from the map is a scale of how fucked people are the closer they are to the bottom of wage earners in their state. Even though Georgia and Louisiana both cap at federal minimum, it would be easier to survive as a low wage earner in LA. Or conversely, DC might be in the top 20 expensive places to live, but they have a higher minimum wage than any state by far ($17.50), so it is truly more affordable to survive in than many states that have a far lower cost of living
When you say 60k deficit, are you saying cost of living minus minimum wage? And is the cost of living for 1 person or a family of 4?
I ask because I know for sure that the cost of living for an individual in Illinois definitely isn’t $115k unless they’re in some VERY specific areas. I’d guess it’d be closer to 60-75k even in Chicago. Don’t really need 100k unless you want to live in like, Lincoln Park or the gold coast
My map is based off of SmartAsset’s 2025 cost of living calculations, which assume a healthy financial breakdown of 50/30/20 of expense, discretionary, and savings percentages.
They offer info for single individuals and for a family of four. My “calculations” for the map are based on their single individual cost of living calculation, and a single individual earning minimum wage full time. And yes, deficit as in cost of living minus what a minimum wage earner actually makes.
I agree its possible to survive on less, however, surviving and having healthy finances are two different things. Although that should be obvious given the numbers we see on the map, considering how many people are surviving on $10-$20 per hour. 50/30/20 is what everyone should be aspiring to, and be better setup to feasibly achieve IMO.
And of course, state averages are certainly averages. It wont represent the actual cost of living in all areas of the state
I was indeed “barely” getting by but I’m still shocked to see 115k. I don’t even make that now and I live very comfortably
Not trying to put down your work at all! I’m just very confused by the data. Are the handful of rich cities really skewing the average that much?
Of course! I didnt mean to imply you were trying to put me down.
Digression
I think the largest thing skewing the averages in most states is probably housing costs. The cost of rent or financing a house is pretty unrealistic anywhere near minimum wage in most places, or even at whatever the bottom of the market actually is in any given area (even if well above legal minimum wage).
Housing should be a bit over 30% of income, so of the 50% of their breakdown in cost of living calculations should be 33% towards rent and 17% to cover literally everything else thats a necessary expense, plus taxes I would assume. That 17% has to do a lot of heavy lifting if you will also have half of your income going to fun stuff and saving money.
Realistically I think many people are stuck with something like 33% on rent, 33% on everything else necessary, and 33% on discretionary shit so they dont off themselves due to bleak life outlook. I know thats where I was at for the first 10 years of my working life
the minimum of this chart being a $60k deficit is rough :(
Are you using each state’s minimum wage or the federal minimum wage?
It is based on each state’s minimum wage, although about 10 states are still matched to the $7.25 federal minimum.
If it were just the federal minimum wage then it would basically be the same as a cost of living map
Some state minimum wages are superceded by city laws.
Good point!